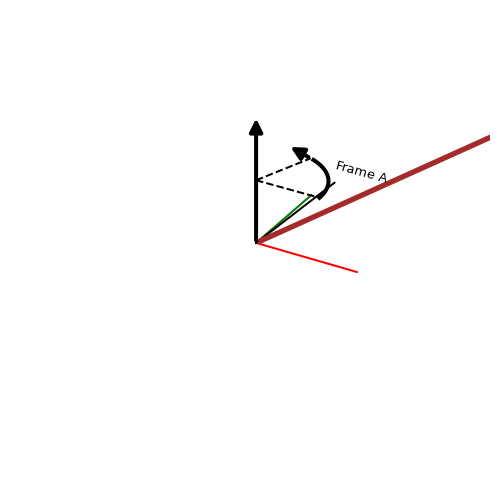
from pytransform3d import rotations as prfrom pytransform3d.plot_utils import plot_vector, remove_frameimport matplotlib.pyplot as pltimport numpy as np# Plot the original frame: Frame Aframe_A = pr.plot_basis(R=np.eye(3), s=0.8, p=0, ax_s=1, label="Frame A")# Remove the axisremove_frame(frame_A)def rotation_matrix(angle,axis):match axis:case'x':return np.array([[1, 0, 0], [0, np.cos(angle), -np.sin(angle)], [0, np.sin(angle), np.cos(angle)]])case'y':return np.array([[np.cos(angle), 0, np.sin(angle)], [0, 1, 0], [-np.sin(angle), 0, np.cos(angle)]])case'z':return np.array([[np.cos(angle), -np.sin(angle), 0], [np.sin(angle), np.cos(angle), 0], [0, 0, 1]])case _:raiseValueError("WHY DID YOU PUT A DIFFERENT THING IN IT!!!!!!!!!")# Define the rotation matrix at a particular axisangle = np.deg2rad(70)axis ='z'R = rotation_matrix(angle,axis)def plot_p_origin_B_in_A(vec,vec_color):""" Put this method before the line you call this method. """ plot_vector(# A vector is defined by start, direction, and s (scaling) start=np.zeros(3), direction=vec, s=1, ax_s=1, # Scaling of 3D axes lw=0, # Remove line around arrow color=vec_color)# Define the origin of Frame B with respect to Frame Ap_origin_B_in_A = np.array([2,2,1]) # x = 2, y = 2, z = 1plot_p_origin_B_in_A(p_origin_B_in_A,"Brown")# Plot Frame Bframe_B = pr.plot_basis(R=R, s=1, p=p_origin_B_in_A, ax_s=1, label="Frame B")remove_frame(frame_B)def plot_vec_in_B(vec,R,p, vec_color):global axismatch axis:case'x': a = np.array([1, 0, 0, angle])case'y': a = np.array([0, 1, 0, angle])case'z': a = np.array([0, 0, 1, angle])case _:raiseValueError("Thats not even an axis Bozo") pr.plot_axis_angle(frame_A, a=a, p=np.zeros(3)) plot_vector(start=p_origin_B_in_A, direction=vec, color=vec_color, s=1, ax_s=1, label='vector')# Define a vector in Frame Bvec_1_B = np.array([0.5,0.5,0.5])print("vec_1_B", vec_1_B)# Plot vec_1_Bplot_vec_in_B(vec_1_B, R, p_origin_B_in_A, "Orange")def homogeneous_transformation(R,p,vec): T = np.zeros((4,4)) T[0:3,0:3] = R T[0:3,3] = np.array([p, 1])return np.multiply(T,vec)# Show the plotplt.show()